
how-to-measure-quality-of-hire
Quality of Hire Metrics: How to Measure Quality of Hire
Most staffing agencies track time-to-fill and cost-per-hire religiously. But those metrics only tell you how fast and how cheaply you placed someone, not whether that person actually performed well, s...
Written by: Saply Team

Quality of Hire Metrics: How to Measure Quality of Hire
Most staffing agencies track time-to-fill and cost-per-hire religiously. But those metrics only tell you how fast and how cheaply you placed someone, not whether that person actually performed well, stayed long, or made your client happy. That’s the gap quality of hire fills, and understanding how to measure quality of hire gives you a real picture of whether your recruitment process is producing results that stick. Without it, you’re optimizing for speed while ignoring the metric that matters most to your clients.
The challenge is that quality of hire isn’t a single number you pull from a dashboard. It’s a composite, built from performance data, retention rates, hiring manager satisfaction, and other inputs that often live in different systems or don’t get tracked at all. That makes it one of the most valuable yet most underreported metrics in recruitment. Getting it right requires a clear framework, the right data points, and a consistent process for combining them into something actionable.
This guide breaks down the specific metrics, formulas, and frameworks you need to start measuring quality of hire at your staffing agency. You’ll also see how the upstream work, particularly how well a CV is tailored and matched to a role before submission, directly influences downstream hire quality. That’s exactly where tools like Saply fit in, helping recruiters submit candidates who are genuinely aligned with job requirements from the start, rather than hoping a loosely formatted resume lands with the right hiring manager.
What quality of hire means and what it includes
Quality of hire measures the value a new employee brings to an organization relative to the cost and effort of hiring them. It’s not a single data point. It’s a composite score that pulls together multiple performance and retention signals into one number or index. For staffing agencies, it tells you whether your placements are actually working out for clients, not just whether you filled the role quickly.
The definition in plain terms
At its core, quality of hire is an assessment of how well a placed candidate performs, fits, and stays in their role. LinkedIn’s Global Talent Trends research has consistently found that quality of hire is the most important metric talent leaders track, yet many agencies struggle to define what it actually includes for their specific context. The inputs you choose to measure depend on your clients’ goals and the type of roles you fill, but the framework stays consistent: gather post-hire data, weight the inputs, and calculate a score.
Quality of hire answers the question your clients actually care about: not “how quickly did you fill the role?” but “did the person you sent work out?”
What goes into a quality of hire score
Most frameworks pull from three to five core inputs. Here’s what typically makes up the calculation:
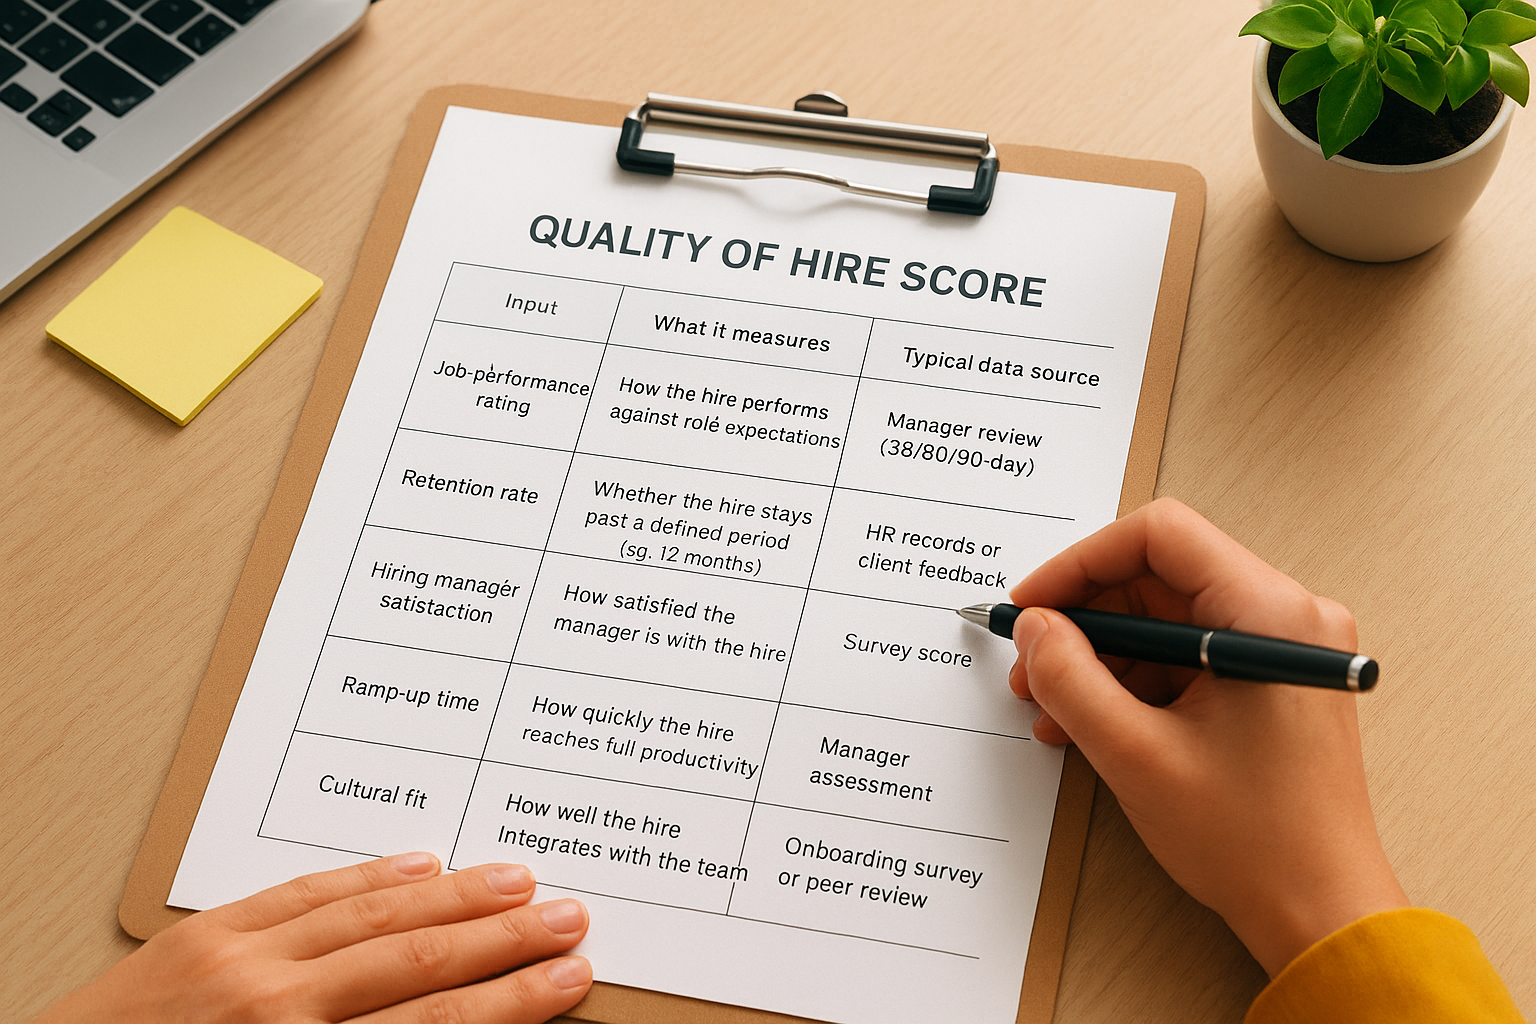
| Input | What it measures | Typical data source |
|---|---|---|
| Job performance rating | How the hire performs against role expectations | Manager review (30/60/90-day) |
| Retention rate | Whether the hire stays past a defined period (e.g., 12 months) | HR records or client feedback |
| Hiring manager satisfaction | How satisfied the manager is with the hire | Survey score |
| Ramp-up time | How quickly the hire reaches full productivity | Manager assessment |
| Cultural fit | How well the hire integrates with the team | Onboarding survey or peer review |
You don’t need all five to get started. Two or three well-tracked inputs give you a much cleaner signal than five inputs with patchy, inconsistent data.
Why quality of hire sits above other recruitment metrics
Speed and cost metrics dominate most agency dashboards because they’re easy to pull. Time-to-fill comes straight from your ATS. Cost-per-hire follows from your budget spreadsheet. Quality of hire requires active coordination with clients after the placement closes, which is why most agencies deprioritize it. That’s a mistake.
When you understand how to measure quality of hire consistently, you shift from being a vendor who fills seats to being a strategic partner who improves workforce outcomes. Clients notice that difference, and it drives repeat business, longer contracts, and referrals. Agencies that track quality of hire can also identify which sourcing channels, CV formats, and screening criteria produce the best long-term results, giving them a compounding advantage over time.
How upstream decisions affect the final score
Upstream choices have a direct impact on where a hire lands on the quality scale. A CV that’s poorly tailored to a job description sends a candidate into an interview without the right framing, which affects both the hiring manager’s first impression and the candidate’s perceived fit. Misalignment between what a CV presents and what the role actually requires often shows up later as a low performance rating or early departure.
That’s why the quality of hire conversation starts well before the offer is signed. Getting the CV-to-role match right during submission is one of the most controllable factors in the entire quality equation, and it’s where many agencies quietly lose ground without realizing it.
Step 1. Define success and pick your core metrics
Before you calculate anything, you need to agree on what a successful hire looks like for each specific role. Every position carries different expectations, and applying one generic scorecard across all your placements dilutes the signal your data actually produces. The foundation of how to measure quality of hire correctly is a role-specific definition agreed upon before the candidate is submitted, not a formula you apply retroactively once problems surface.
Align with your client on what good looks like
Start every placement with a direct conversation about outcomes. Ask the hiring manager what a strong new hire looks like at 30, 60, and 90 days. The answers will vary significantly: a sales hire might be assessed on pipeline activity and call volume, while a logistics coordinator might be measured on accuracy rates or shift adherence. Document these expectations before submission so you have a concrete baseline to measure against once the hire is in the role.
Use this template to capture role success criteria before you submit a candidate:
| Role | 30-day target | 60-day target | 90-day target | Primary metric |
|---|---|---|---|---|
| Sales Executive | Onboarding complete, 10 calls logged | 2 qualified opportunities | $20k pipeline | Opportunity creation |
| Customer Support Agent | Handles 80% of tickets independently | CSAT score above 4.0 | Resolution rate above 85% | CSAT |
| Logistics Coordinator | Zero processing errors | Sub-2% error rate | Fully autonomous on system | Error rate |
The clearer your pre-hire success definition, the less ambiguous your post-hire measurement becomes.
Pick two to four metrics you can realistically track
Resist the urge to measure everything at once. Tracking five inputs with inconsistent data will produce a noisier score than tracking three inputs collected reliably after every placement. For most staffing agencies starting out, the most practical combination is hiring manager satisfaction, 90-day retention, and performance rating at the first formal review. These three require minimal client-side infrastructure and are easy to gather through a short post-placement survey sent 90 days after start date.
Once consistent data flows from your core metrics across several placements, you can expand to include inputs like ramp-up time or cultural fit scores. Build the data collection habit first, then grow the model incrementally rather than trying to track everything from day one.
Step 2. Collect the right data and set check-in points
Once you’ve defined success criteria, you need a system that reliably captures performance data after every placement. The biggest reason agencies fail at learning how to measure quality of hire correctly isn’t a lack of intention but a lack of structure. Without scheduled check-in points, the post-hire data you need disappears into client inboxes or never gets collected at all, leaving you with impressions instead of evidence.
Set up a post-placement check-in schedule
Every placement should trigger a fixed sequence of follow-up touchpoints with the hiring manager. Three check-ins work well for most agency workflows: a short call at 30 days, a structured survey at 90 days, and a retention confirmation at 12 months. These intervals align with the natural stages of onboarding and give you data at the points where early warning signs and longer-term outcomes both become visible.

Use this schedule as your post-placement follow-up template:
| Check-in point | Timing | Format | What to capture |
|---|---|---|---|
| Early check-in | 30 days after start | Phone call or email | Initial performance impression, onboarding progress |
| Core assessment | 90 days after start | Short survey (3-5 questions) | Manager satisfaction score, performance rating, ramp-up status |
| Retention confirmation | 12 months after start | Email or ATS update | Still employed, promoted, or departed |
Automating these touchpoints through your CRM or ATS calendar reduces the chance that a check-in gets skipped during a busy placement period.
Use a short survey to capture manager feedback
Your 90-day survey is the most important data collection point in this process. Keep it under five questions so hiring managers actually complete it. Longer surveys get ignored or abandoned halfway through, which leaves you with incomplete data that skews your quality of hire scores and forces you to make decisions without a reliable baseline.
Here’s a repeatable survey template to send at the 90-day mark:
- On a scale of 1-5, how would you rate this hire’s performance so far?
- Has the hire reached the productivity level you expected by this point? (Yes / Partially / No)
- How satisfied are you overall with this placement? (1-5)
- Is the hire still in the role? (Yes / No, and if no, what was the reason?)
- Would you use our agency again for a similar role? (Yes / Maybe / No)
Record every response in a centralized tracker tied to the recruiter, role type, and sourcing channel so you can build a comparable dataset across placements and start seeing patterns as your sample size grows.
Step 3. Calculate a quality of hire score and index
Once you have clean data flowing from your post-placement check-ins, you can start combining it into a single score. The most widely referenced approach to how to measure quality of hire uses a simple average formula that LinkedIn’s talent research helped popularize: add up the individual metric scores, divide by the number of inputs, and express the result as a percentage. That gives you a single comparable number per placement that you can benchmark across recruiters, roles, and sourcing channels over time.
The standard quality of hire formula
The core formula is simple to apply once your inputs are expressed as percentages:
Quality of Hire (QoH) = (Metric 1 + Metric 2 + Metric 3 + … + Metric N) / N
Each input needs to be converted to a percentage before you plug it in. If your hiring manager satisfaction survey produces a 4 out of 5, that becomes 80%. If your 90-day retention indicator is binary (still employed = 100%, departed = 0%), treat it the same way. A placement with an 80% performance rating, 100% retention, and 75% manager satisfaction produces a quality of hire score of 85%.
A score above 80% consistently signals that your submission, screening, and matching process is working well for that role type.
How to weight each input
Not every metric carries equal importance for every role type. A 12-month retention rate matters more for a permanent placement than for a contract role, while performance ratings carry more weight in high-complexity positions. A simple unweighted average works well when you’re starting out. Once you build enough data, shifting to a weighted average formula gives you a score that reflects what your clients actually prioritize.
Here’s a weighting template you can adapt immediately:
| Metric | Default weight | Permanent role | Contract role |
|---|---|---|---|
| Performance rating | 33% | 35% | 30% |
| Manager satisfaction | 33% | 30% | 35% |
| Retention rate | 34% | 35% | 35% |
Adjust these weights based on direct input from your clients during the Step 1 success-definition conversation. A client who consistently emphasizes long-term team stability wants retention weighted higher. A client focused on project output cares more about ramp-up speed and performance ratings. Capturing those preferences upfront means your score reflects the outcome the client is actually paying for, not a generic average that treats every placement the same.
Step 4. Break down results to find what drives quality
A single aggregate score tells you where you stand, but it doesn’t tell you why. To get real value from the quality of hire data you’ve collected, you need to slice your scores across different variables and look for patterns that explain what separates your strongest placements from your weakest ones. This is where learning how to measure quality of hire shifts from being a reporting exercise to being a genuine diagnostic tool for your agency.
Segment scores by recruiter, channel, and role type
Raw scores become meaningful when you compare them across dimensions. Break your quality of hire results into at least three segments from the start: the recruiter who made the placement, the sourcing channel the candidate came through (job board, referral, direct outreach, ATS database), and the role category. Running this analysis regularly reveals which combinations consistently produce high-quality placements and which ones underperform without an obvious reason.

If one sourcing channel produces 90-day retention rates 20 percentage points below another, that data alone justifies reallocating where you invest your sourcing budget.
Here’s a simple segmentation table to track scores across dimensions:
| Segment | Q1 Avg QoH | Q2 Avg QoH | Trend | Action flag |
|---|---|---|---|---|
| Recruiter A | 82% | 79% | Down | Review submission criteria |
| Recruiter B | 88% | 91% | Up | Identify and replicate approach |
| Job board sourced | 74% | 72% | Flat | Review screening filters |
| Referral sourced | 91% | 89% | Stable | Expand referral program |
| Tech roles | 86% | 84% | Flat | Check JD alignment |
| Admin roles | 77% | 73% | Down | Review onboarding support |
Identify which inputs drag the score down
Once you’ve segmented your data, drill into the individual metric inputs for any segment scoring below your target threshold. Low manager satisfaction scores often point to a mismatch between what the client expected and what the recruiter submitted. Low performance ratings without corresponding retention problems frequently indicate that the candidate is staying but struggling, which often traces back to a CV that overstated skill depth relative to actual job requirements.
Tracking which input pulls each segment’s score down gives you a clear intervention point rather than a vague sense that something isn’t working. If retention is fine but performance is low, you examine role briefing quality and CV-to-job alignment before submission. If satisfaction is low but performance is acceptable, you look at client expectation management during the intake process. Pinpointing the failing input makes your improvement work in the next step far more targeted and immediately actionable.
Step 5. Improve hiring and onboarding based on findings
Data only has value when it changes what you do next. The patterns you identified in Step 4 should now drive specific changes to two distinct parts of your process: how you brief, screen, and submit candidates before the placement closes, and how you support new hires through their first 90 days once they start. Acting on both fronts is how you sustainably raise your quality of hire scores rather than watching the numbers fluctuate without explanation.
Adjust your intake and submission process
When your analysis points to low CV-to-job alignment as a recurring factor in weak performance ratings, the fix starts at intake, not at interview. Review the job briefing you collected from the client and compare it against the CVs you submitted. If the briefing was vague or captured in shorthand, tighten your intake template to capture specific skill requirements, seniority expectations, and measurable performance targets before you start sourcing. Sharper intake data leads directly to better-matched candidates at submission, which is exactly the upstream improvement that moves scores upward as you continue to learn how to measure quality of hire over time.
Framing matters as much as content. A candidate whose CV presents experience at the right level but uses the wrong terminology for the role often underperforms in early manager assessments. Tailoring each CV explicitly to the job description, using the language the client actually uses for the role, closes that gap before the candidate walks into an interview and reduces the chance of a mismatch showing up in your 90-day survey results.
Fixing CV-to-role alignment upstream costs far less time and effort than managing a struggling placement after the hire starts.
Strengthen onboarding support for placed candidates
Weak retention and slow ramp-up times frequently trace back to insufficient onboarding structure rather than poor candidate selection. Where your scores show this pattern, build a first-week checklist you share with the hiring manager at placement close. This gives the client a concrete starting point and keeps your agency visibly engaged after the role is filled.
Use this onboarding handoff template with every placement:
| Day | Action | Owner |
|---|---|---|
| Day 1 | Role overview and team introduction | Hiring manager |
| Day 2-3 | System access and tool training | IT or manager |
| Day 5 | First check-in on questions or blockers | Recruiter |
| Day 30 | Performance expectation review | Hiring manager |
Sharing this template with clients reinforces your agency’s value as a placement partner rather than a CV sender, and it gives new hires a structured start that directly supports the retention and performance inputs your quality of hire formula depends on.
Wrap up
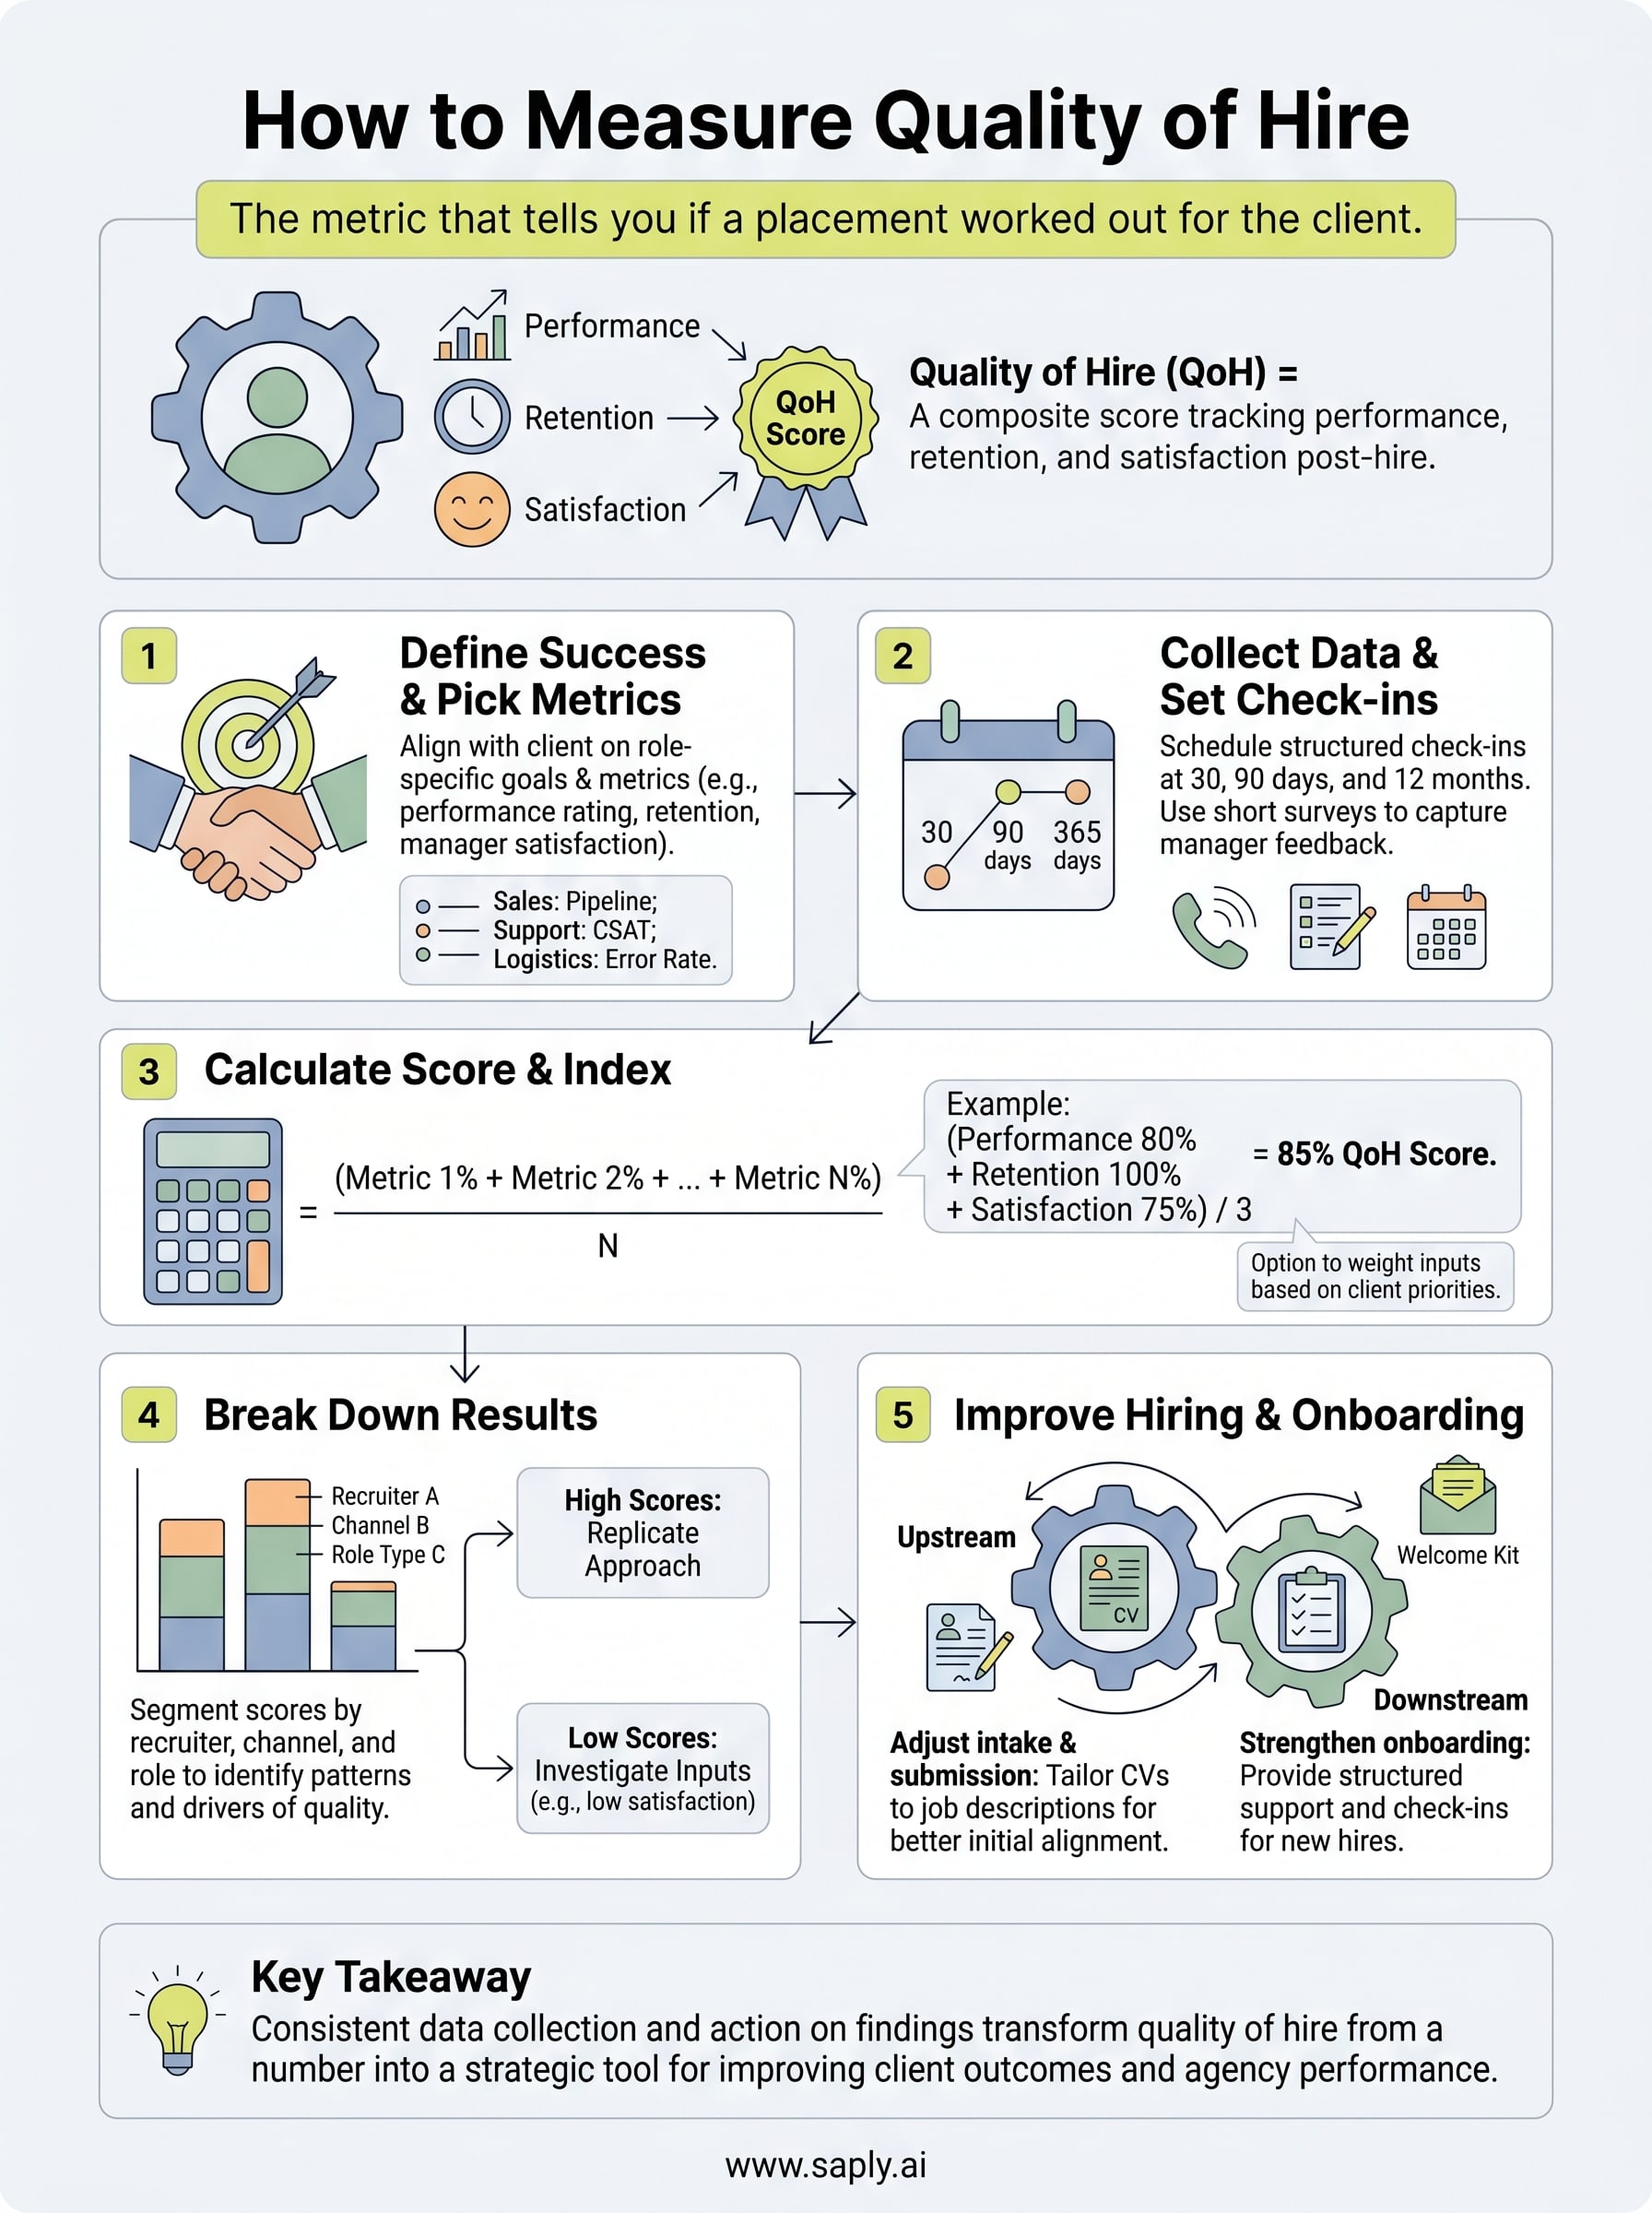
Learning how to measure quality of hire is a five-step process: define what success looks like for each role, collect data at structured check-in points, calculate a composite score, break down results by recruiter and sourcing channel, and adjust your intake and onboarding process based on what the data shows. Each step builds on the last, and the system only works when you run it consistently across every placement, not selectively after a problem surfaces.
Your upstream work matters more than most agencies realize. A CV that’s precisely tailored to the job description reduces the mismatch between client expectations and hire performance before the candidate ever starts, which shows up directly in your 90-day scores. If you want to close that gap faster, see how Saply helps recruiters match and tailor CVs to job requirements before submission, so your quality of hire data reflects genuinely strong placements rather than lucky ones.