how-to-measure-recruiter-performance
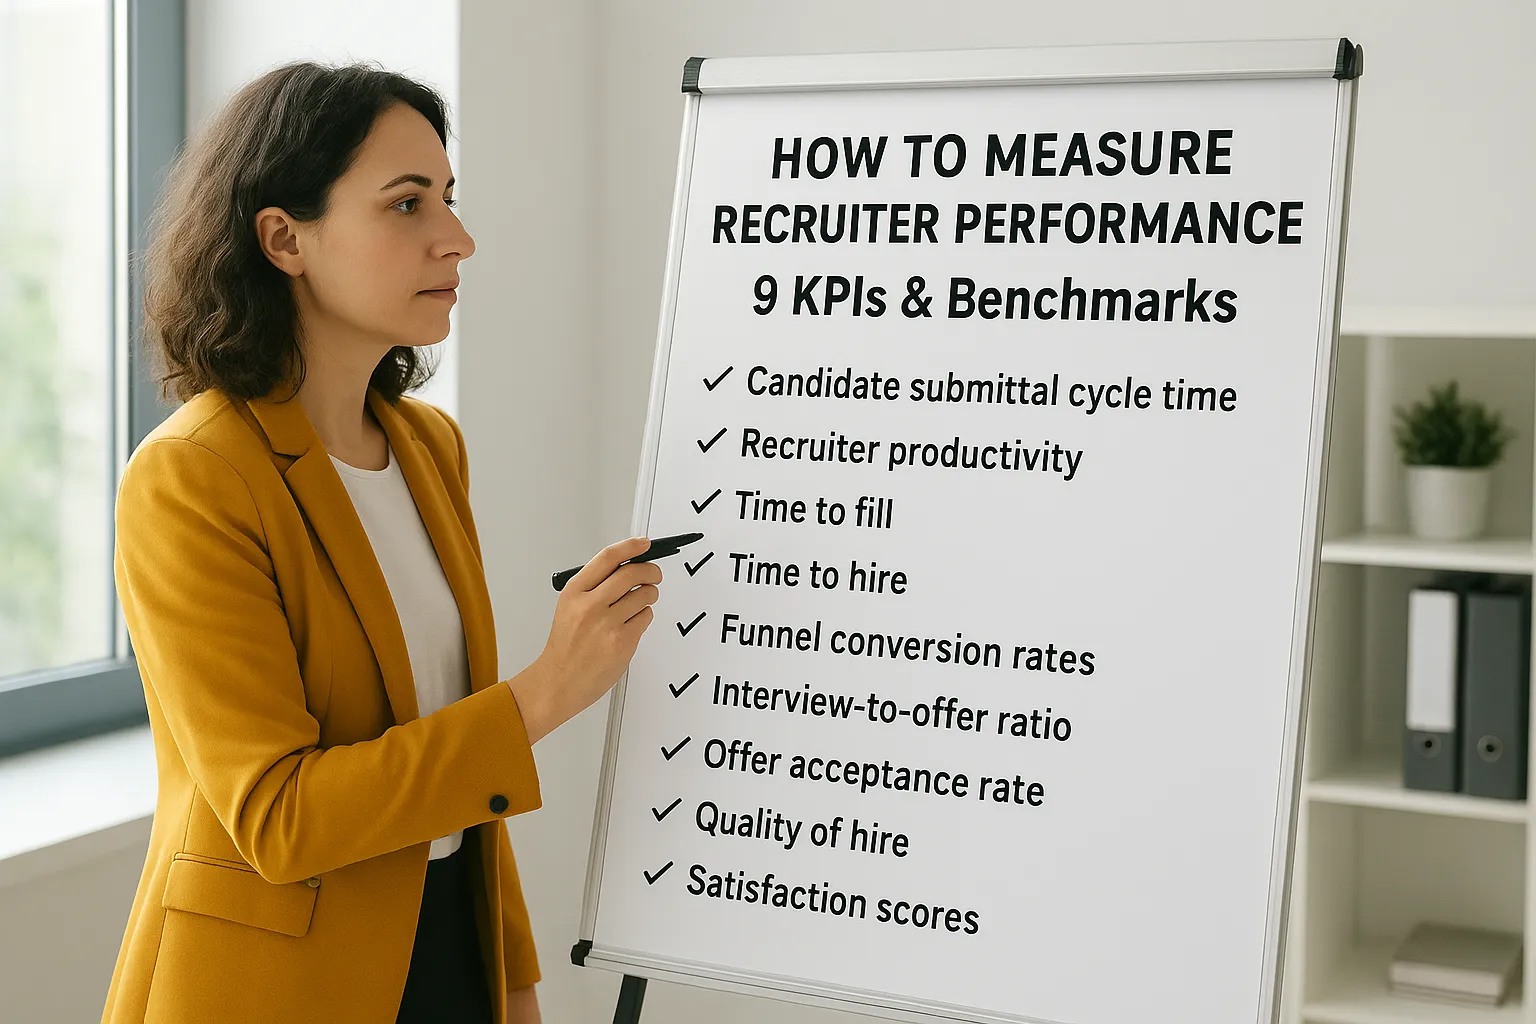
How To Measure Recruiter Performance: 9 KPIs & Benchmarks
Most staffing agencies track revenue and placements but struggle with how to measure recruiter performance at the operational level. Which recruiter submits candidates fastest? Who gets the highest cl...
Written by: Saply Team
How To Measure Recruiter Performance: 9 KPIs & Benchmarks
Most staffing agencies track revenue and placements but struggle with how to measure recruiter performance at the operational level. Which recruiter submits candidates fastest? Who gets the highest client acceptance rate? Where do bottlenecks actually sit, sourcing, formatting, or interview coordination? Without clear answers, managers end up relying on gut feel instead of data.
The fix isn’t complicated, but it does require tracking the right KPIs consistently. Metrics like time-to-submit, submittal-to-interview ratio, and fill rate each reveal a different piece of the puzzle. Together, they show you exactly where your team excels and where hours quietly disappear into low-value tasks, like manual CV formatting and tailoring, which is precisely the workflow Saply automates for recruitment teams.
This article breaks down nine recruiter performance KPIs that actually matter, complete with formulas, industry benchmarks, and practical ways to improve each one. Whether you’re evaluating an individual recruiter or an entire team, these metrics give you a clear framework to measure output and quality side by side.
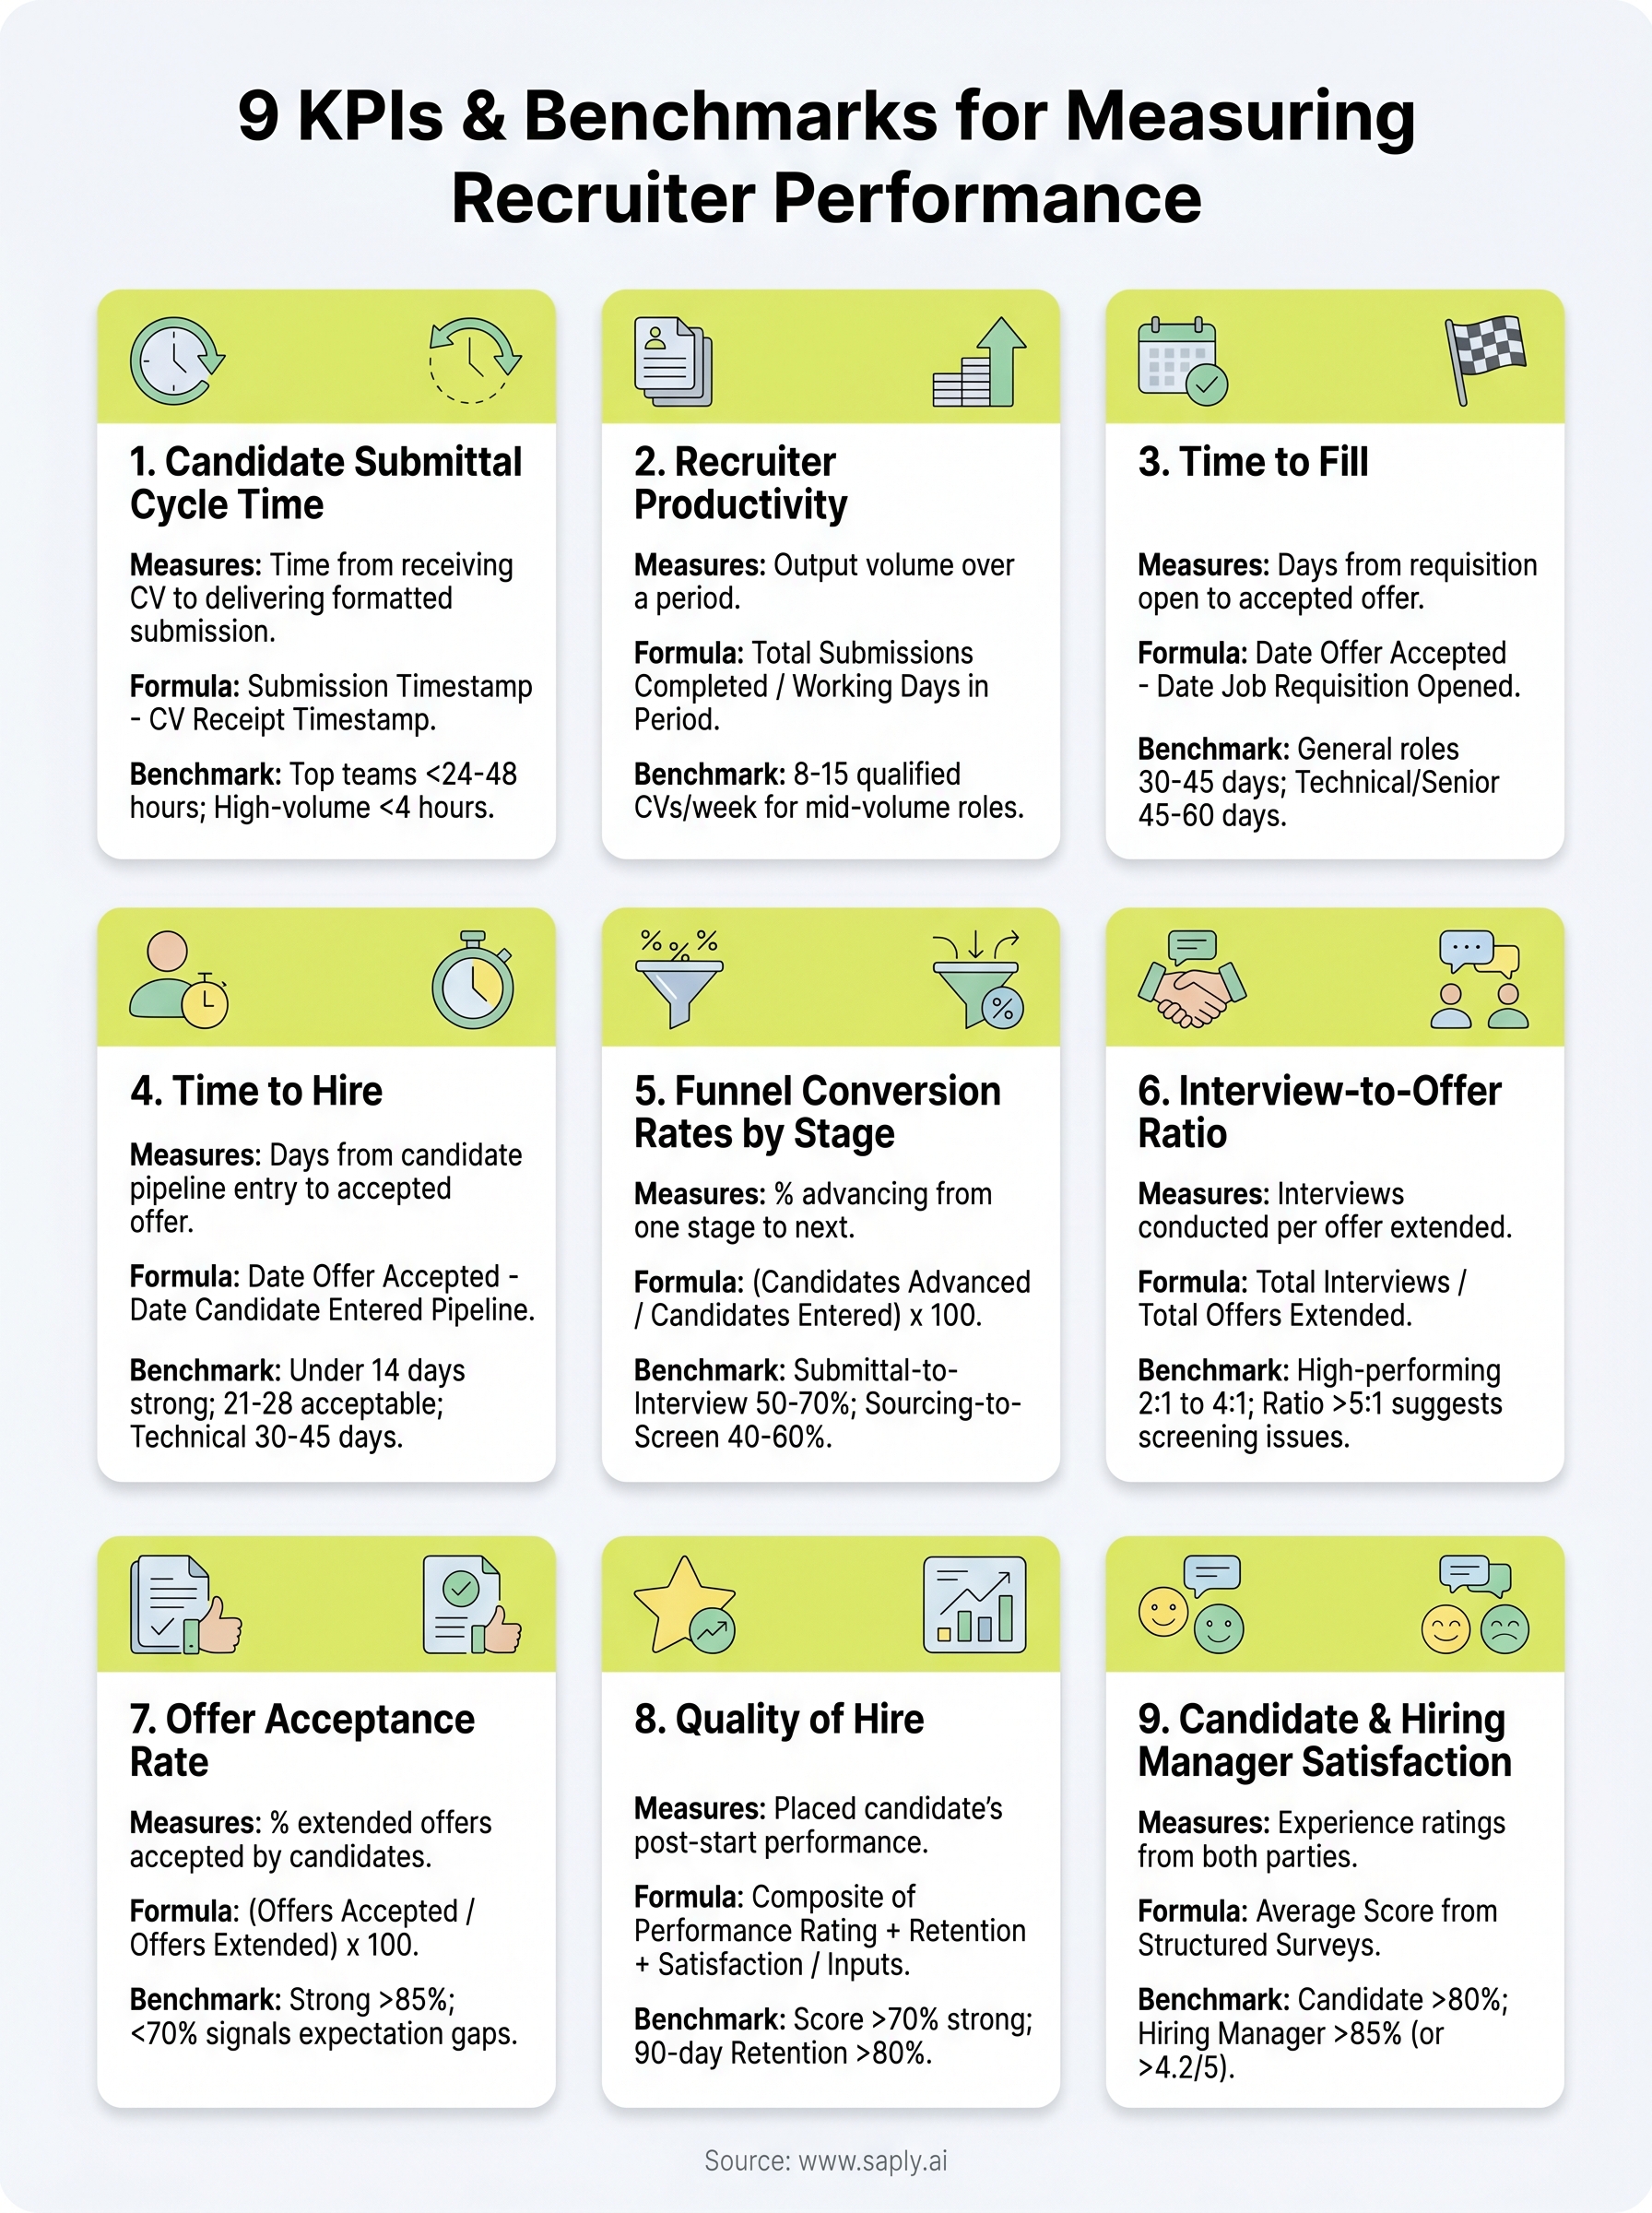
1. Candidate submittal cycle time
Candidate submittal cycle time tracks how long it takes a recruiter to go from receiving a candidate CV to delivering a formatted, tailored submission to a client or ATS. It sits at the very start of your pipeline, and slow submittal times affect every downstream metric that follows. This is one of the clearest windows into individual recruiter efficiency and a strong starting point when figuring out how to measure recruiter performance across your team.
What it measures and why it matters
This metric captures the total elapsed time between a candidate CV arriving and a complete submission being sent to the hiring manager or client. It matters because speed of submission is a direct competitive advantage in staffing. When two agencies source the same candidate, the one that submits first typically controls the placement, and every hour of delay is a real risk.
How to calculate it
Record the timestamp when a CV is received and the timestamp when the formatted submission is sent or logged in your ATS. The formula is straightforward:
Submittal Cycle Time = Submission Timestamp minus CV Receipt Timestamp
Track this per recruiter and average it over a rolling weekly or monthly period to identify trends rather than single outliers.
Benchmarks and target ranges
Industry targets vary by role type, but top-performing staffing teams submit within 24 to 48 hours of receiving a qualified candidate CV. For high-volume, lower-complexity roles, leading teams consistently hit under 4 hours. For senior or technical placements, 24 to 72 hours is a reasonable target range.
If your team consistently exceeds 72 hours per submission, you likely have a process bottleneck in formatting or tailoring, not just sourcing.
How to improve it in a staffing workflow
The biggest time drain in the submittal cycle is manual CV formatting and tailoring, which can consume 30 to 60 minutes per candidate. Automating that step with a tool like Saply eliminates the copy-paste and reformatting work and cuts cycle time significantly. You should also standardize your submission checklist so recruiters follow a consistent process rather than making different judgment calls on every submission.
Common measurement mistakes
Teams often record the submission date without capturing the CV receipt timestamp, which makes the metric useless for any meaningful comparison. Another frequent error is logging a submission before it is fully client-ready, which inflates apparent speed while masking quality gaps that only surface when clients push back or reject the candidate outright.
2. Recruiter productivity
Recruiter productivity measures how much output a recruiter generates over a given period. While submittal cycle time focuses on speed per submission, productivity zooms out to show total volume of work completed, giving managers a fuller picture of capacity and workload balance across the team.
What it measures and why it matters
This metric captures the number of submissions, placements, or sourcing activities a recruiter completes within a defined timeframe, typically weekly or monthly. It helps managers spot overloaded team members, identify underperformers, and set realistic expectations. When you want to understand how to measure recruiter performance at a team level, productivity is one of the first numbers to pull.
How to calculate it
Track the total count of completed, client-ready submissions per recruiter within your chosen time window. A simple formula works well:
Recruiter Productivity Score = Total Submissions Completed / Working Days in Period
You can also break this down by submission type or role seniority to get a more granular view of where time is being spent.
Benchmarks and target ranges
High-performing agency recruiters typically submit 8 to 15 qualified, formatted CVs per week for mid-volume roles. Output drops for senior or specialist searches, where 3 to 6 per week is a reasonable benchmark.
Productivity numbers only mean something when paired with quality indicators. High volume with low acceptance rates signals a speed-over-substance problem.
How to improve it without hurting quality
Automating repetitive formatting steps is the fastest way to increase productive output without cutting corners. When recruiters spend less time reformatting CVs, they can process more candidates in the same number of hours.
Common measurement mistakes
A common error is counting submissions that were returned or rejected by the client as productive output. Only log submissions that were fully reviewed and accepted into the client’s process to keep your numbers honest.
3. Time to fill
Time to fill measures how long it takes to move a candidate from an open job requisition to an accepted offer. It captures the full pipeline, not just one stage, which makes it one of the most useful metrics for spotting where your overall process loses momentum.
What it measures and why it matters
This metric tracks the total number of days between a job requisition opening and a candidate accepting an offer. It reflects how well your entire recruitment process runs, not just a single recruiter’s effort. When you’re evaluating how to measure recruiter performance at the agency level, time to fill reveals systemic delays that individual output scores alone can miss.
How to calculate it
The formula is straightforward:
Time to Fill = Date Offer Accepted minus Date Job Requisition Opened
Track this per role and per recruiter to separate process-wide delays from individual bottlenecks. Averaging across a quarter gives you a reliable baseline.
Benchmarks and target ranges
Industry benchmarks shift significantly by role type. For general staffing roles, 30 to 45 days is a common target, while technical or senior positions typically run 45 to 60 days. Agencies consistently beating these numbers tend to have faster, higher-quality CV submission cycles at the front end.
If your time to fill regularly exceeds 60 days, the bottleneck usually sits in the early sourcing and submission stages, not the interview loop.
How to improve it across the full process
Cutting submittal cycle time is the fastest lever you can pull to shrink time to fill. When recruiters submit formatted, tailored CVs faster, clients move candidates forward sooner. Automating CV formatting and tailoring eliminates a consistent delay point early in the pipeline without adding workload.
Common measurement mistakes
Many teams start the clock at first recruiter action rather than requisition open date, which understates the true figure. Another common error is closing the metric at offer sent rather than offer accepted, which skips the final step and inflates apparent performance.
4. Time to hire
Time to hire tracks how long a candidate moves through your process, from pipeline entry to accepted offer. Unlike time to fill, this metric focuses on the candidate’s experience of your speed rather than the full requisition lifecycle. It’s a key piece of how to measure recruiter performance at the interview and closing stages.
What it measures and why it matters
This metric captures the total days between a candidate entering your pipeline and accepting an offer. It shows how efficiently your team moves people through screening, interviews, and negotiation. Slow times frustrate candidates and raise the risk of losing them to a competing offer before your client decides.
How to calculate it
Time to Hire = Date Offer Accepted minus Date Candidate Entered Pipeline
Track this per recruiter and per role type. Breaking it down by role category gives you a clearer view of where your process stalls than a single blended average.
Benchmarks and target ranges
For most staffing roles, under 14 days is a strong benchmark, and 21 to 28 days is acceptable when multiple interview rounds are involved.
Technical or leadership roles often extend to 30 to 45 days. When numbers consistently exceed those ranges, the bottleneck usually sits in interview scheduling or offer approval, not sourcing.
How to improve it inside the interview loop
Submitting complete, well-tailored CVs on the first pass reduces client revision requests and keeps interview scheduling on track. Fewer follow-up rounds between you and the hiring manager mean candidates stay engaged longer through to offer acceptance.
Common measurement mistakes
Many teams start the clock at the first interview rather than pipeline entry, which understates the true figure. Avoid closing the metric at verbal acceptance; only record the end date when written confirmation arrives to keep your data accurate.
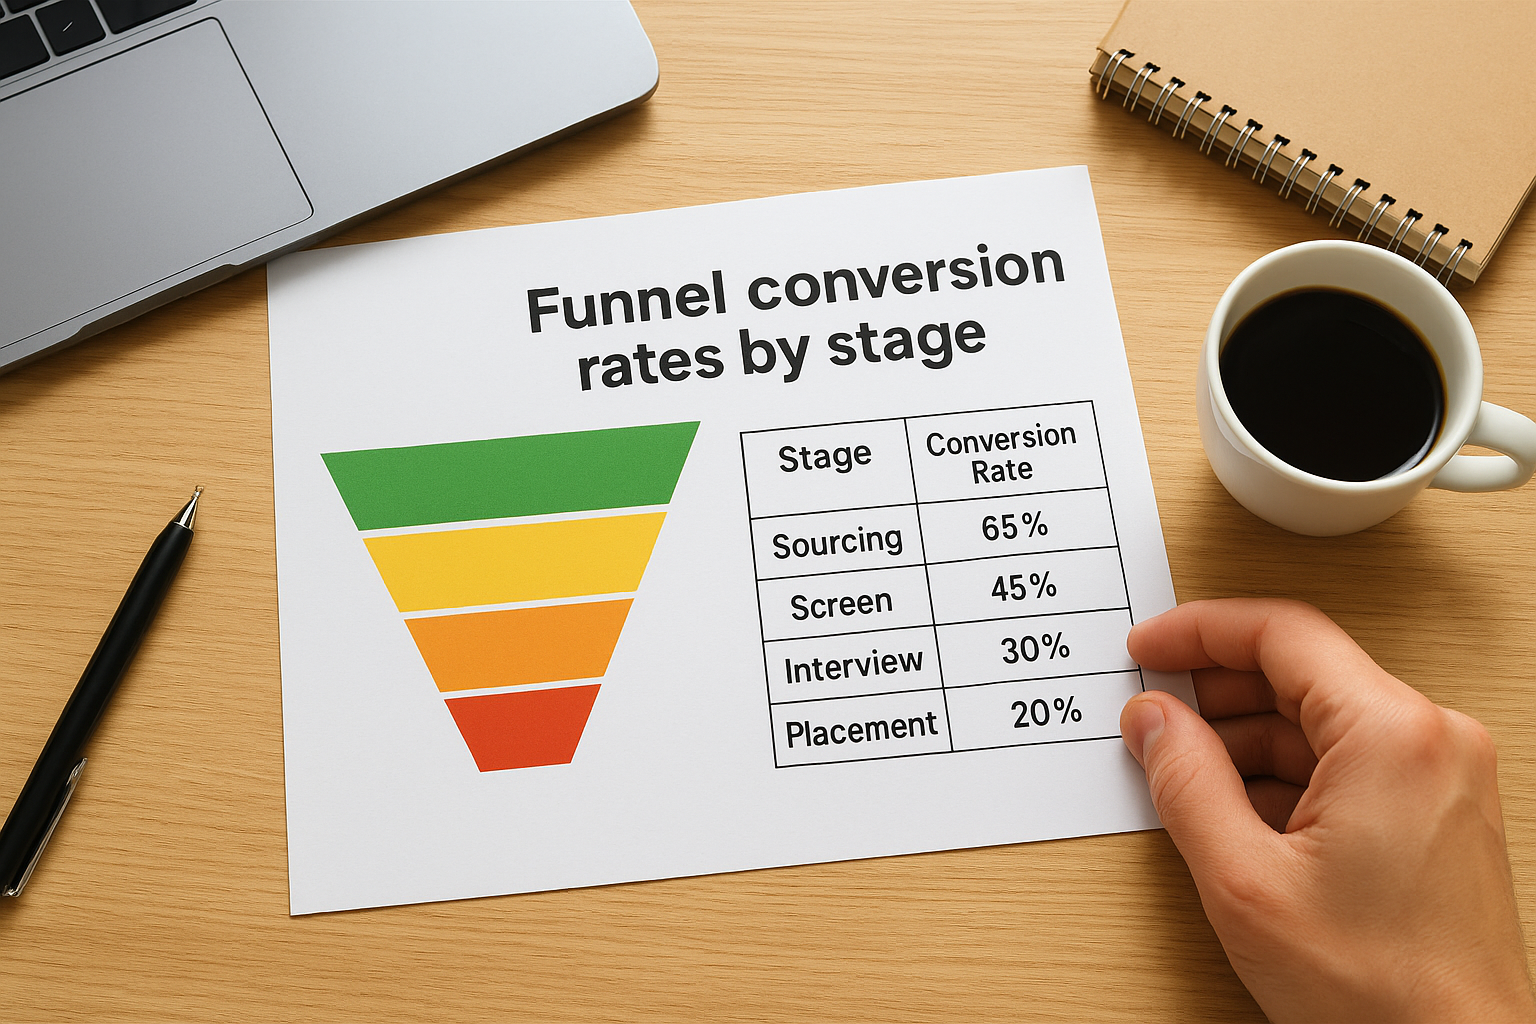
5. Funnel conversion rates by stage
Funnel conversion rates tell you how many candidates move from one stage to the next across your entire recruitment pipeline. Instead of looking at total output or end-to-end timing, this metric shows you exactly where candidates drop out, which makes it one of the sharpest tools for figuring out how to measure recruiter performance at a stage-by-stage level.
What it measures and why it matters
This metric captures the percentage of candidates who advance from each stage to the next, covering sourcing through to placement. It exposes the precise point where your process leaks volume, whether that is at initial screening, CV submission, or client review.
How to calculate it
Divide the number of candidates who advance from a stage by the total who entered that stage, then multiply by 100.
Stage Conversion Rate = (Candidates Advanced / Candidates Entered) x 100
Track this separately for each stage rather than blending them into a single funnel number.
Benchmarks and target ranges
A strong submittal-to-interview conversion rate sits between 50 and 70 percent; anything below 30 percent signals a CV quality or targeting problem.
Sourcing-to-screen rates vary widely, but 40 to 60 percent is a reasonable starting point for most agency workflows.
How to improve weak stages
Pinpoint the stage with the lowest conversion rate first rather than trying to fix everything at once. If submittal-to-interview is weak, improving CV tailoring and match quality directly addresses the gap.
Common measurement mistakes
Teams often blend all stage conversions into one overall funnel rate, which hides the specific problem area. Track each stage independently to keep your analysis actionable.
6. Interview-to-offer ratio
The interview-to-offer ratio shows how many interviews your team conducts per offer extended. It directly reflects how well your recruiters screen and prepare candidates before client-facing conversations happen. When you’re thinking about how to measure recruiter performance beyond submission volume, this ratio separates efficient teams from ones that rely on quantity over quality.
What it measures and why it matters
This metric captures the number of interviews conducted relative to offers extended during a set period. A high ratio means your recruiters are sending under-qualified candidates to client interviews, which wastes client time and steadily damages your agency’s credibility. It is one of the clearest signals of whether CV quality and screening rigor are actually aligned.
How to calculate it
Divide total interviews held by total offers extended during a defined period.
Interview-to-Offer Ratio = Total Interviews / Total Offers Extended
Track this per recruiter and per role type to identify where screening quality breaks down rather than hiding problems in a blended average.
Benchmarks and target ranges
A ratio of 3:1 or lower signals strong candidate quality; anything above 5:1 suggests a screening or tailoring problem upstream.
Most high-performing staffing agencies target between 2:1 and 4:1 across their general placement volume.
How to improve interview calibration
Tighter job description alignment during CV tailoring is the fastest way to move this ratio in the right direction. When submitted CVs closely match what the client actually needs, fewer interviews fail to convert. Reviewing rejected interview feedback consistently helps you recalibrate your screening criteria faster.
Common measurement mistakes
Teams often count phone screens as formal interviews, which inflates the ratio and hides real performance gaps. Only log confirmed client or hiring manager interviews to keep this number comparable across your team.
7. Offer acceptance rate
Offer acceptance rate tells you what percentage of extended offers candidates actually accept. When this number drops, it signals a disconnect between the candidate’s expectations and what the client is presenting, which is a gap your team created somewhere earlier in the process. This metric is an important piece of how to measure recruiter performance at the closing stage.
What it measures and why it matters
This metric tracks the proportion of formal offers that candidates accept versus those they decline or let expire. A low acceptance rate costs your clients time and delays placements, and it usually points to poor expectation-setting during the screening and briefing stages rather than a problem with the offer itself.
How to calculate it
Divide total offers accepted by total offers extended, then multiply by 100.
Offer Acceptance Rate = (Offers Accepted / Offers Extended) x 100
Track this per recruiter and per role type to isolate where declines concentrate.
Benchmarks and target ranges
An offer acceptance rate above 85 percent is considered strong; anything below 70 percent signals a recurring expectation or compensation gap that needs attention.
Most staffing agencies target between 80 and 90 percent across general placement volume.
How to improve closing and reduce declines
Brief candidates thoroughly on compensation range, role expectations, and timeline before the offer stage so there are no surprises. Confirm candidate commitment explicitly at each interview stage rather than assuming intent.
Common measurement mistakes
Many teams record verbal acceptances as confirmed, which overstates the rate. Only close the metric when written confirmation is received to keep your figures reliable.
8. Quality of hire
Quality of hire measures how well a placed candidate actually performs in the role after they start. It connects your recruiting activity directly to business outcomes, which makes it the most comprehensive signal when thinking about how to measure recruiter performance beyond speed and volume alone.

What it measures and why it matters
This metric captures the actual value a hired candidate delivers after placement, typically evaluated through performance ratings, retention at a defined milestone, and hiring manager satisfaction scores. It closes the feedback loop between front-end recruiting decisions and real-world results, giving you data to improve future sourcing and screening.
How to calculate it
Most agencies track quality of hire as a composite score built from two or three weighted inputs. A common formula is:
Quality of Hire = (Performance Rating + Retention Rate + Hiring Manager Satisfaction) / Number of Inputs x 100
Set a 90-day and 6-month checkpoint to capture early indicators before longer-term performance data becomes available.
Benchmarks and target ranges
A quality of hire composite score above 70 percent is considered strong; consistent scores below 50 percent signal a mismatch between candidate screening and actual role requirements.
Most staffing agencies target retention above 80 percent at the 90-day mark as a practical proxy when full performance data is unavailable.
How to improve quality signals earlier
Tightening CV tailoring to match specific job requirements rather than general role categories improves the accuracy of your initial candidate-to-role fit. Reviewing post-placement feedback regularly with your recruiters shortens the learning cycle between submission quality and real outcomes.
Common measurement mistakes
Many teams skip structured post-placement check-ins, which leaves quality of hire as a guess rather than a tracked figure. Only collect data at consistent time intervals so scores stay comparable across recruiters and role types.
9. Candidate and hiring manager satisfaction
Satisfaction scores give you direct feedback from the two people who experience your recruiting process firsthand: the candidate and the hiring manager. When thinking about how to measure recruiter performance beyond operational metrics, satisfaction data fills the gap that numbers like time to fill and offer acceptance rate leave open.
What it measures and why it matters
This metric captures how positively candidates and hiring managers rate their experience working with your recruiters. Poor candidate experience reduces referral rates and future engagement, while low hiring manager scores erode client relationships that your business depends on for repeat placements.
How to calculate it
Send a short structured survey to both candidates and hiring managers after each placement closes. Average the scores separately for each audience.
Satisfaction Score = Total Score Received / Total Responses x 100
Track scores per recruiter and per quarter to identify consistent patterns rather than reacting to single responses.
Benchmarks and target ranges
Candidate satisfaction above 80 percent and hiring manager satisfaction above 85 percent are strong targets for staffing agencies aiming to retain clients and build candidate pipelines.
Most high-performing teams benchmark hiring manager satisfaction above 4.2 out of 5 on structured surveys.
How to improve experience without slowing down
Set clear expectations at the start of each engagement so candidates and hiring managers know what to expect at each stage. Consistent communication at key milestones prevents the silence that drives most satisfaction complaints.
Common measurement mistakes
Many agencies collect satisfaction data inconsistently, only surveying after successful placements rather than across all outcomes. Skipping post-decline or post-withdrawal feedback removes the most useful signal for identifying where experience breaks down.
Put the scorecard to work
These nine KPIs give you a complete framework for how to measure recruiter performance at every stage of your pipeline. Tracking all nine together reveals patterns that no single metric can show on its own, and it gives your recruiters a clear picture of where they perform well and where they need to tighten up.
Start by identifying the two or three metrics your team currently tracks least consistently. Building a baseline over 30 to 60 days before drawing conclusions gives you data you can actually act on rather than react to. From there, review the full scorecard quarterly and connect each metric directly to a specific process change.
If slow submittal cycle time keeps pulling your other numbers down, automating CV formatting and tailoring is the fastest single fix you can make. See how Saply cuts submission time for staffing teams and start building a faster, more measurable recruitment operation today.